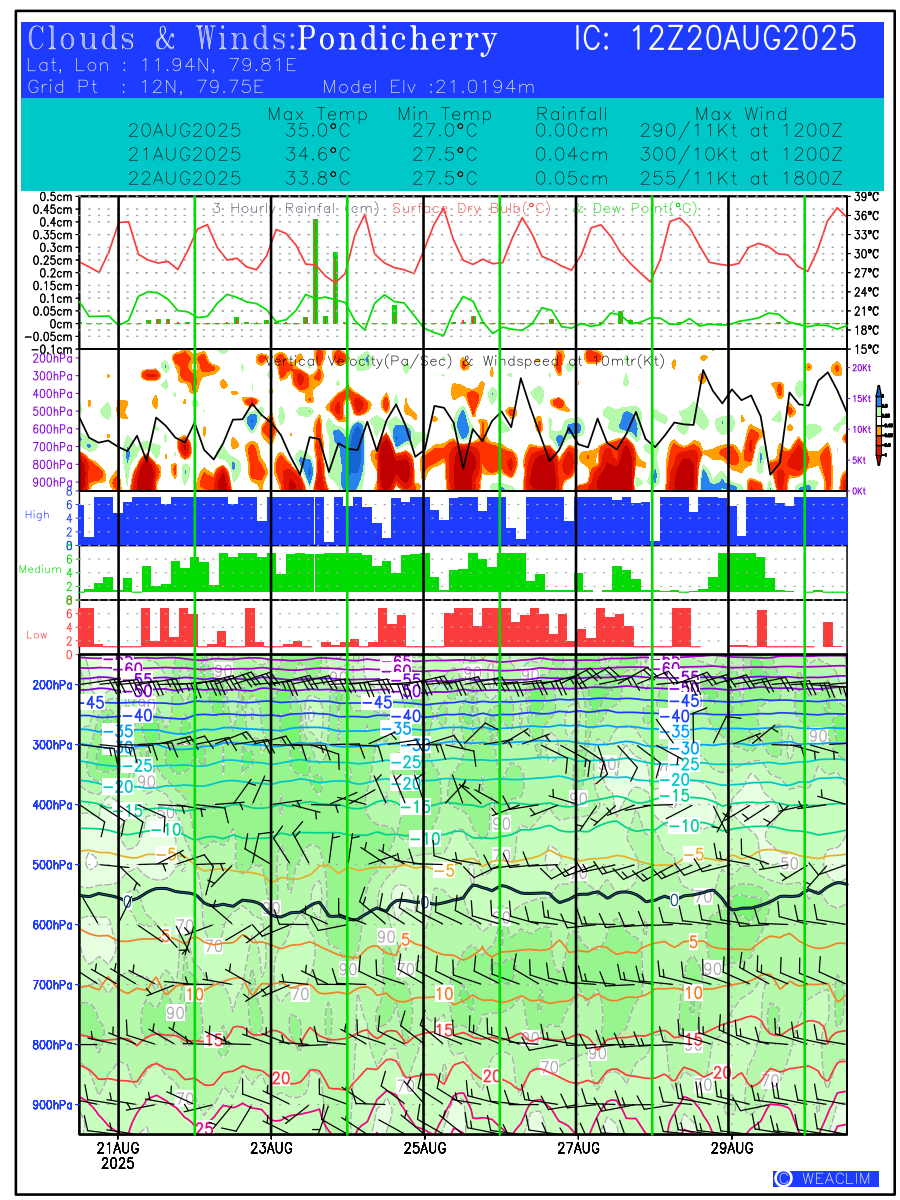
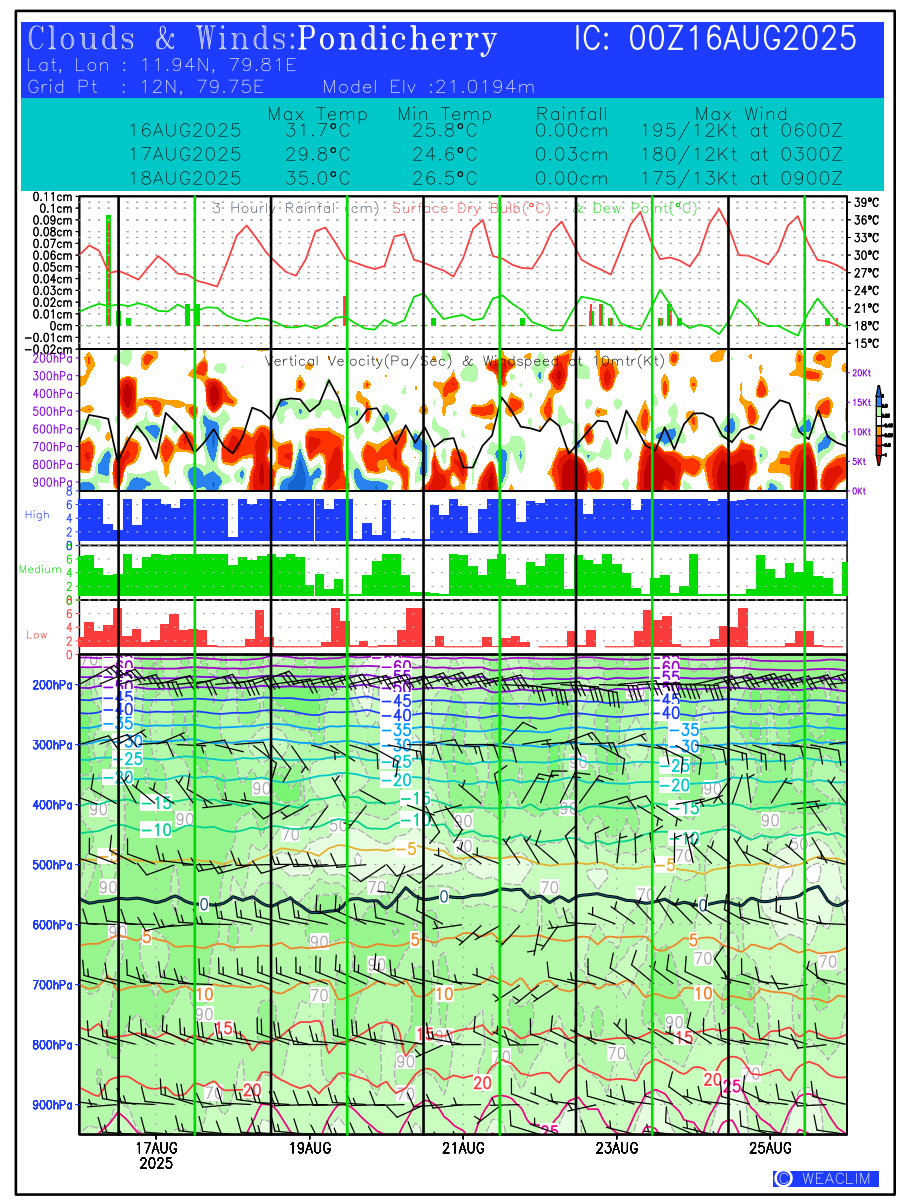
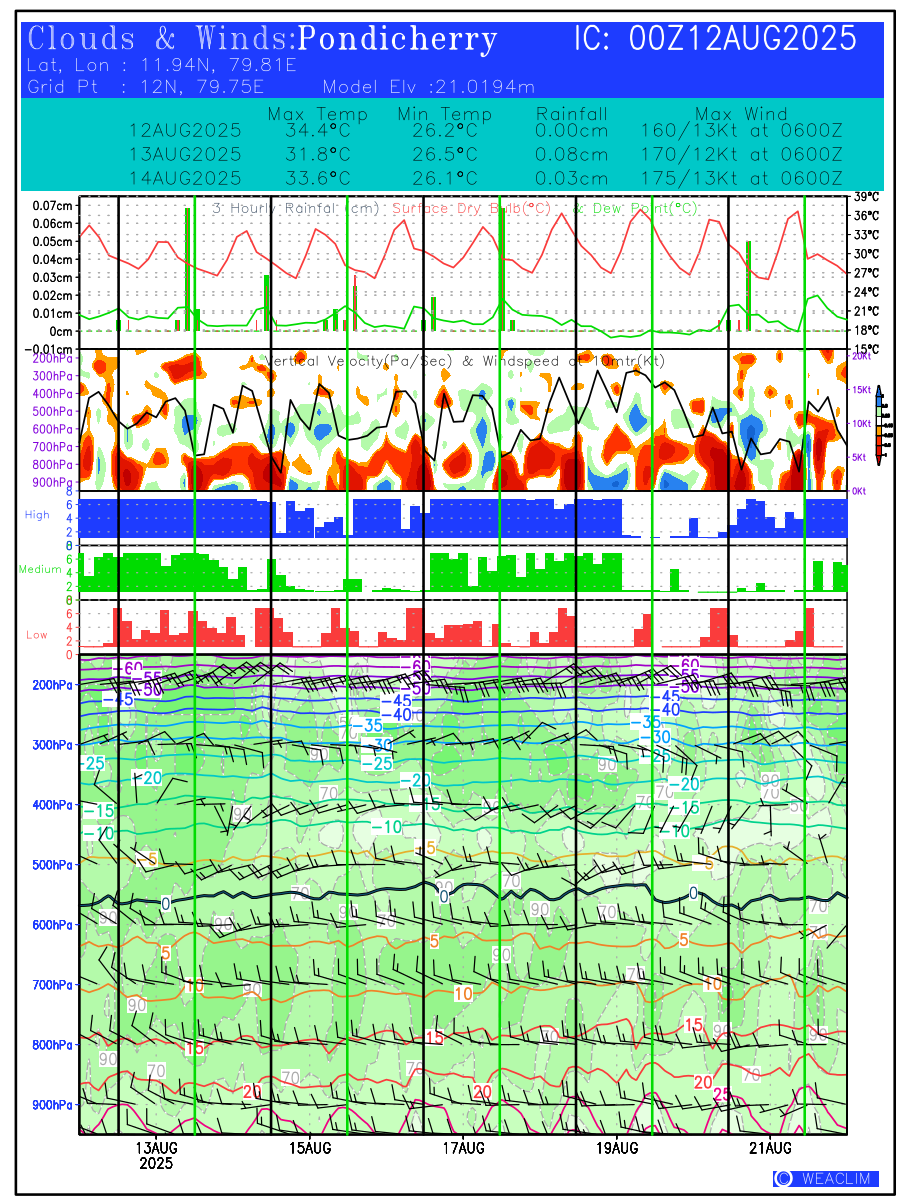
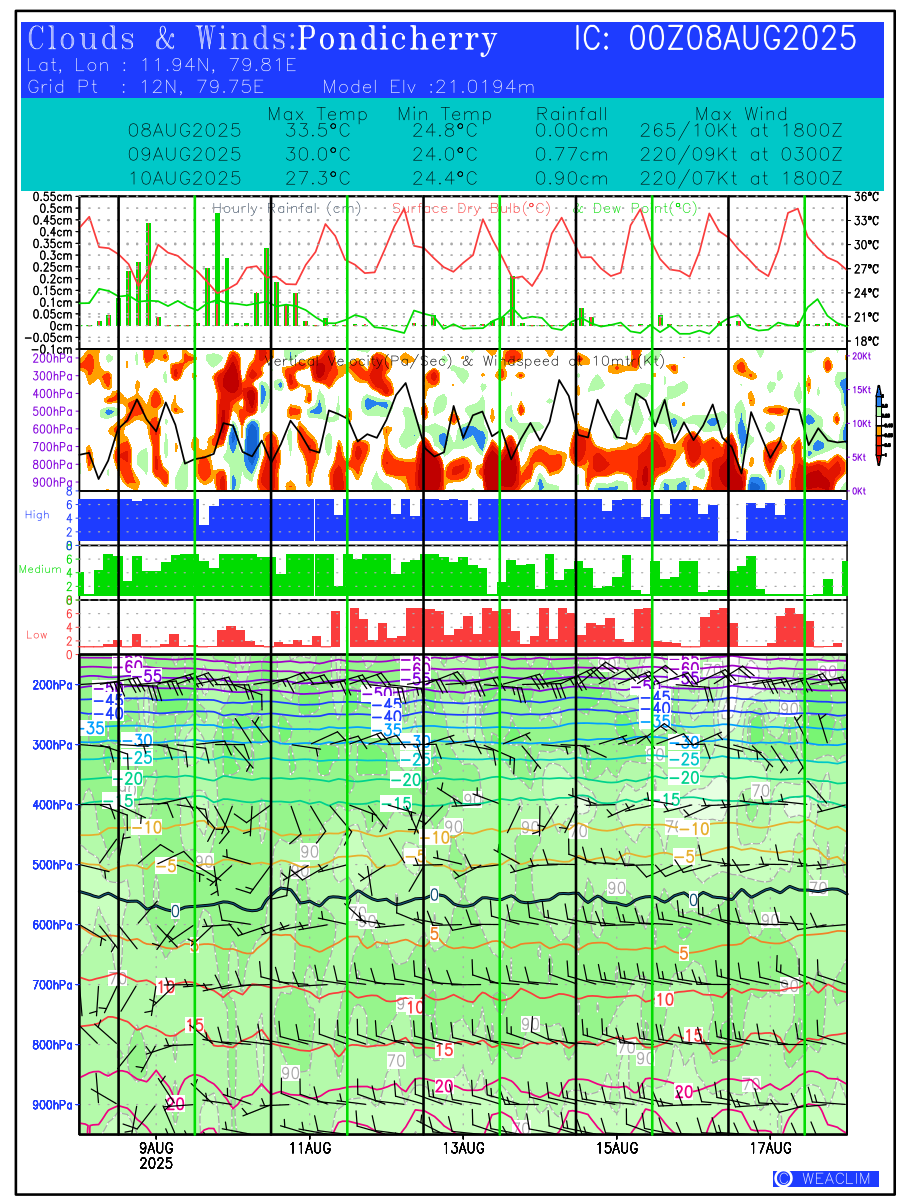
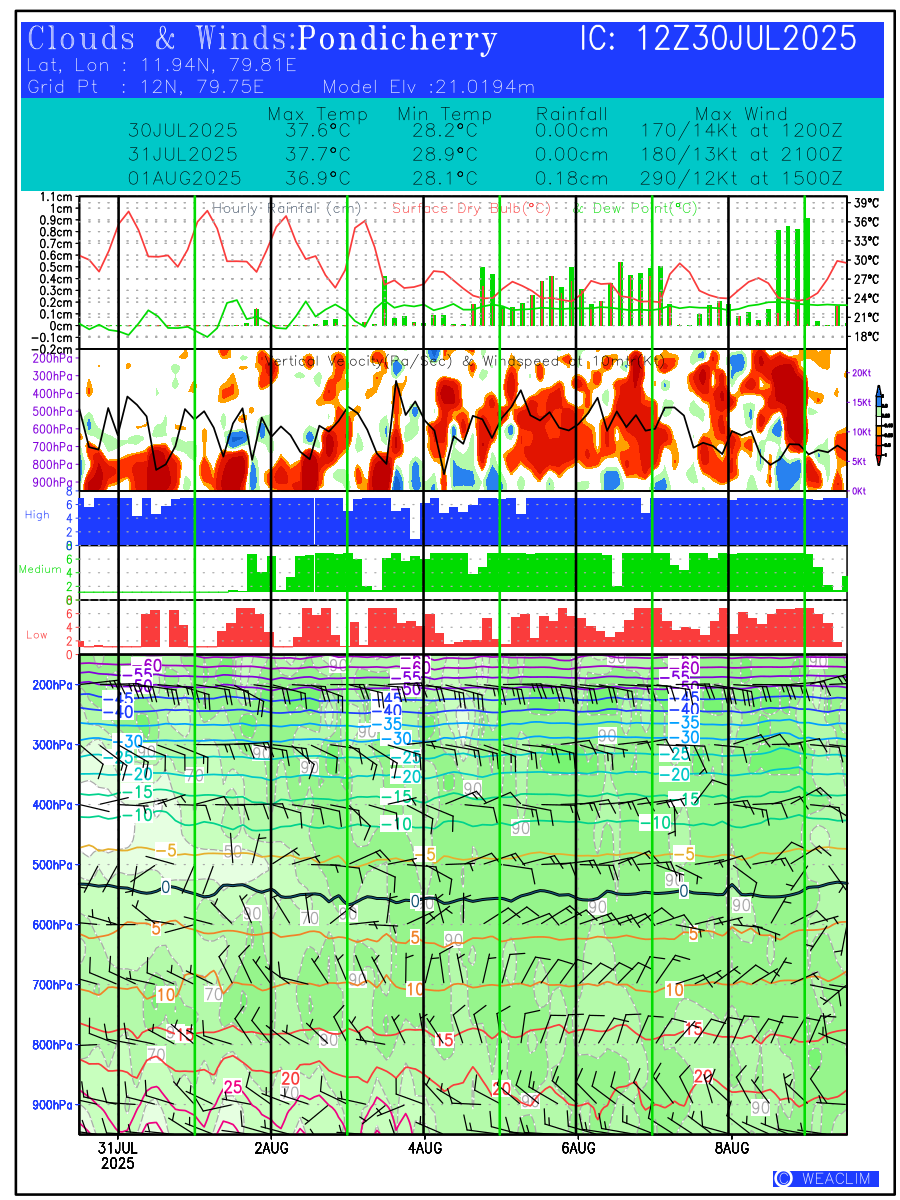
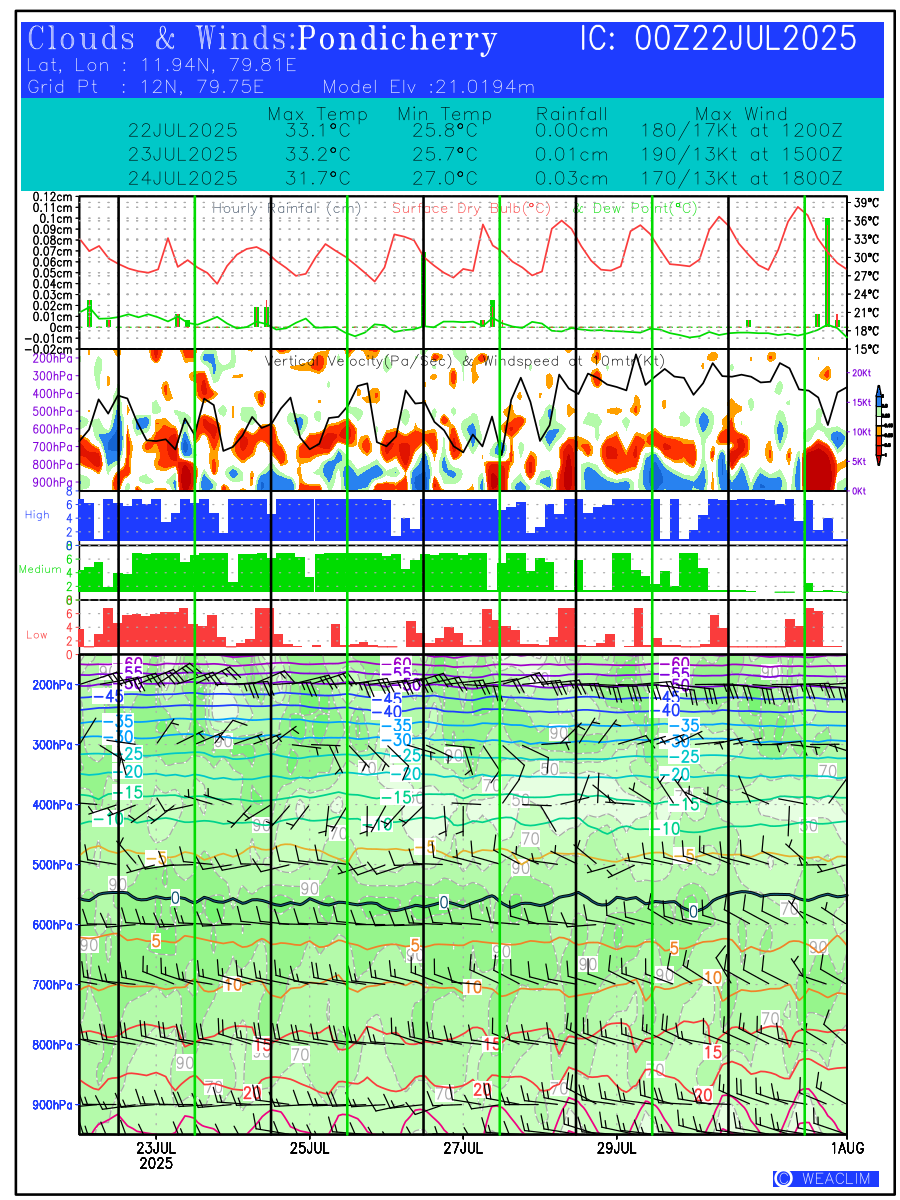
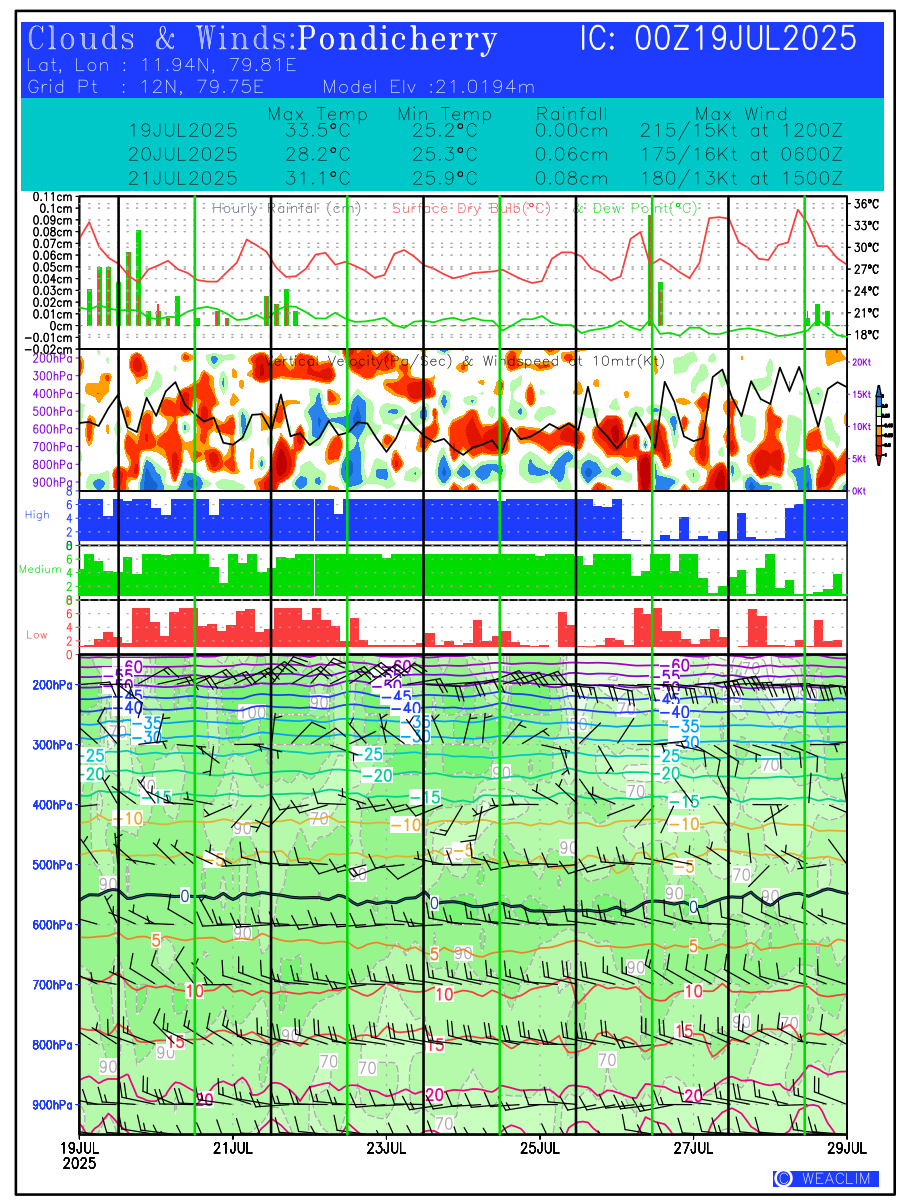
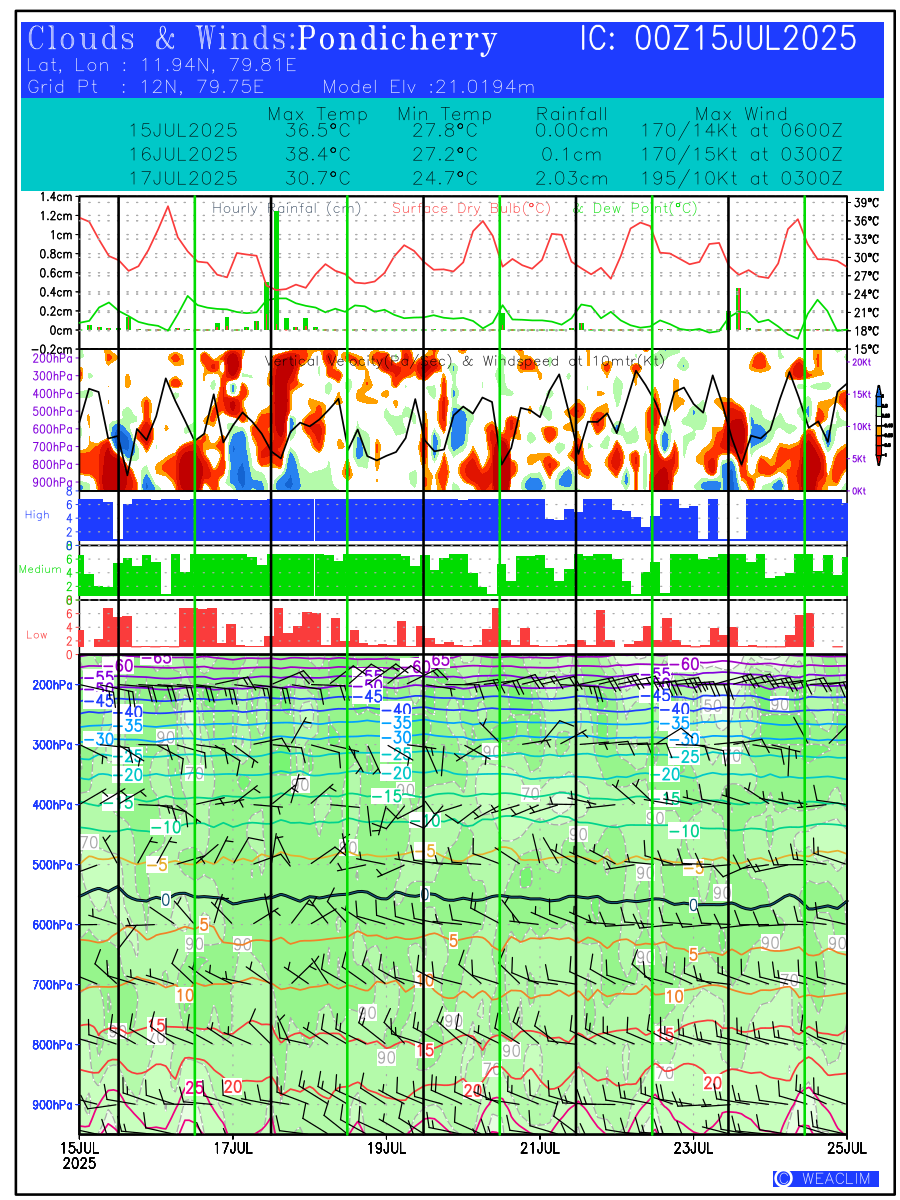
Location Specific Forecasts or Meteograms are graphics that display predicted meteorological data over time for a particular location. They provide a convenient way to quickly visualize and interpret complex weather data, allowing users to make informed decisions based on the latest weather information. These predictions are customised to a time frame with validity of ten days from the date of issue. First Panel at the bottom is the time height representation of the atmospheric profile from surface to 100 hPa level showing the magnitude and direction of winds through wind barbs, isotherm of temperature with freezing level depicted in black and the relative humidity contoured and shaded in green. Second, third and fourth panels show the oktas of low, medium and high clouds in red, green and blue colors, respectively. The fifth panel shows time height representation of Vertical Velocity (ω in Pa/Sec) contoured in shaded colors and the wind speed at 10 meters (kt). Vertical velocity shows the magnitude of verti al winds with negative values showing upward movement (causing formation of convective clouds) and positive values showing downward movement (leading to clear skies) of the airmass at the selected location. The sixth panel shows the Hourly Rainfall (in cm) along with Surface Dry Bulb and Dew Point Temperatures ( o C) over the time period of next ten days. The seventh panel shows the values of predicted Maximum and Minimum Temperature ( o C), Rainfall amount (in cm) and time of Maximum Winds (kt) expected during the next three days.The eighth panel at the top gives the general information on name of the selected location, time of initial conditions (in UTC), latitude and longitude of the location and its model elevation.
Showing 1–12 of 22 results
