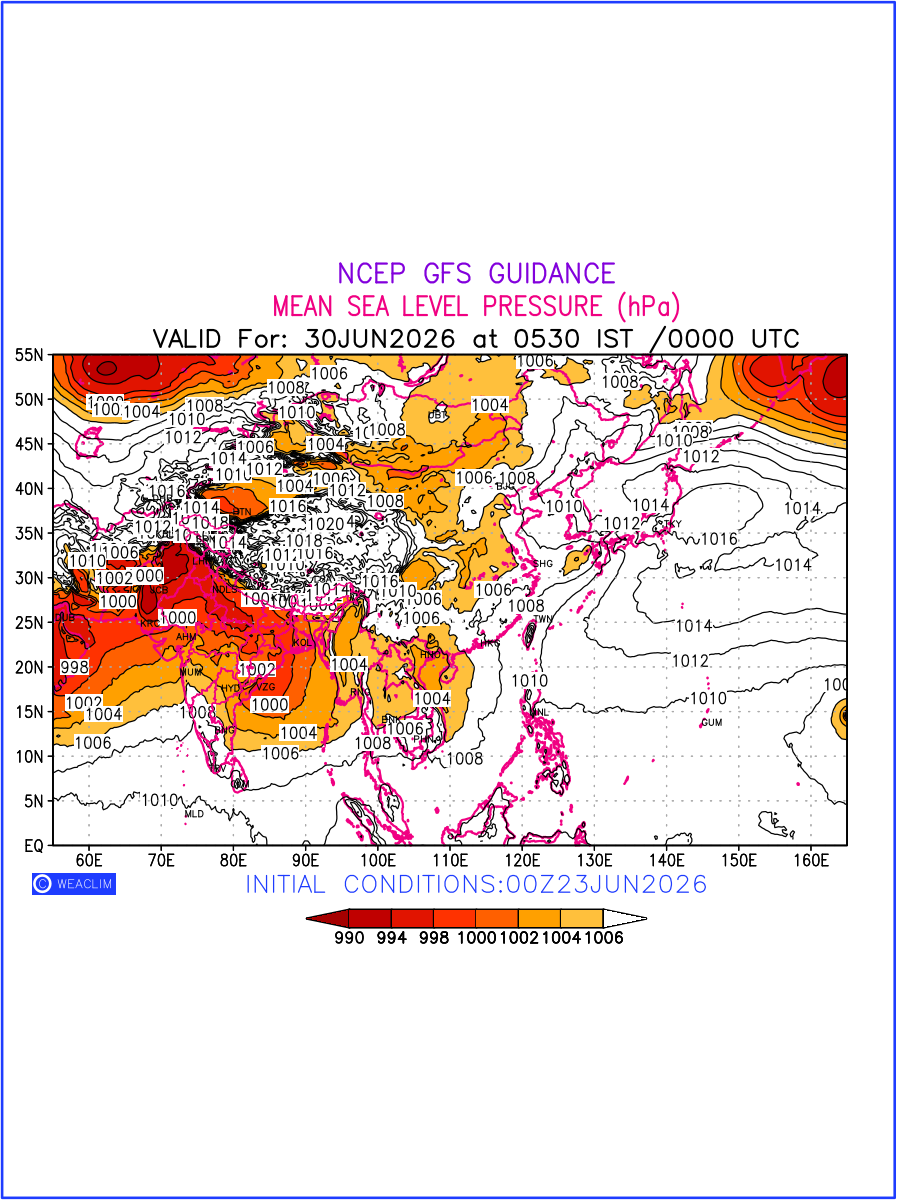
Mean Sea Level Pressure (MSLP) charts at the 24th hour for East Asia typically show a color-coded contour map of atmospheric pressure at sea level, with lines of equal pressure (isobars) indicating areas of high and low pressure over a geographic area. Meteorologists use these charts to identify areas of high and low pressure, which can give indications of storms, cold fronts, or warm fronts. The MSLP charts are also useful in identifying areas of convergence and divergence in the atmosphere, which can influence the formation or decay of weather systems.
Showing 1–12 of 44 results